High Density Grid
 No comments
 During each of the cruises for this long-term set of observations, we have spent most of one day conducting a detailed investigation of the marine environment that the penguins nesting near Palmer Station use as a foraging region. The term “high density grid” refers to the fact that we are looking at a small-scale resolution survey grid for the details of distribution. The timing of mid-January is based on the time of peak penguin chick growth, as documented over the years.
The goal is to simultaneously map out:
(1) the distribution of the Adélie penguins as they hunt for food at sea
(2) the distribution of their primary food source in summer (Antarctic krill)
(3) different measures of water characteristics such as phytoplankton concentrations, surface sea water temperature, and surface salinity.
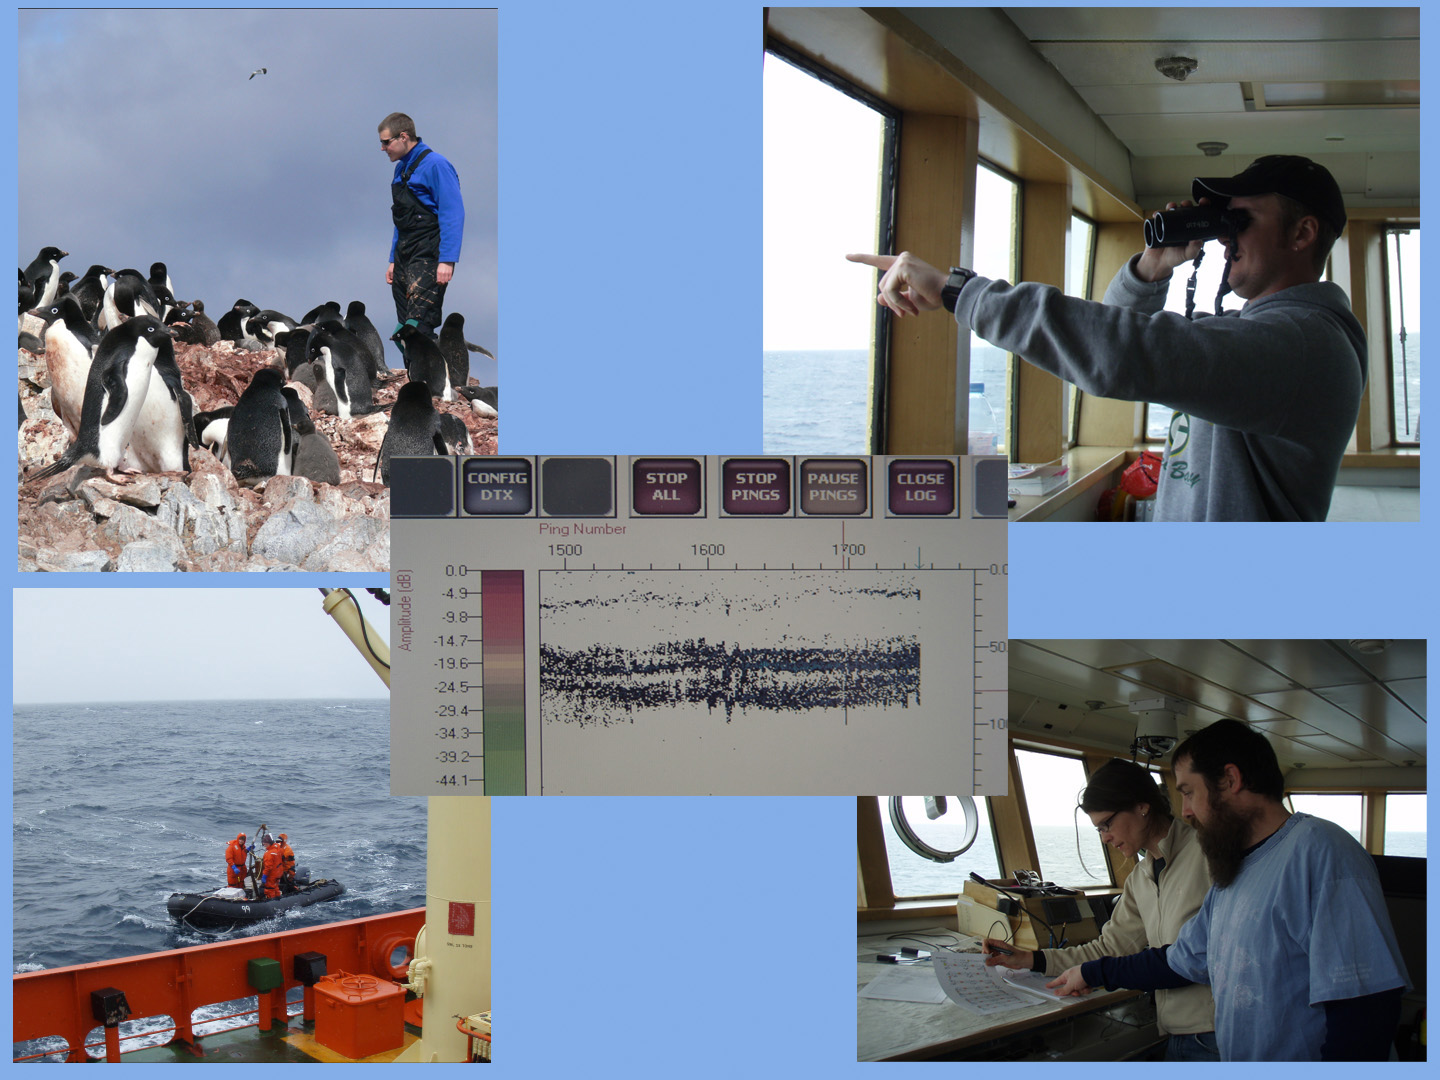
At upper left, Nick Metheny surveys an Adélie penguin colony near Palmer Station before the cruise begins. At upper right, Eric Erdmann spots seabirds from his observation post on the bridge. At center, the computer shows Antarctic krill in the upper 40 meters of the water column. At lower left, Alex Lowe, Langdon Quetin, and Doug Fink in Rubber Duke I draw alongside the Antarctic Research and Supply Vessel (ARSV) L. M. Gould after searching for krill all morning. And at lower right, keeping our records straight during this time of simultaneous data collection requires good coordination and team work, and Heidi Geisz and Chip Cotton help out with the coordination among groups.
We document the distribution of Antarctic krill in this area with bioacoustic transects, as described yesterday. A view of the computer screen for the bioacoustic setup (center of above photo) shows a layer of Antarctic krill in the upper 40 meters of the water column. In addition to the bioacoustic transects, an inflatable boat rigged with a winch and net is launched and used to collect Antarctic krill from the foraging region to document the sizes available for the penguins to feed on, and to determine how well the krill are feeding.
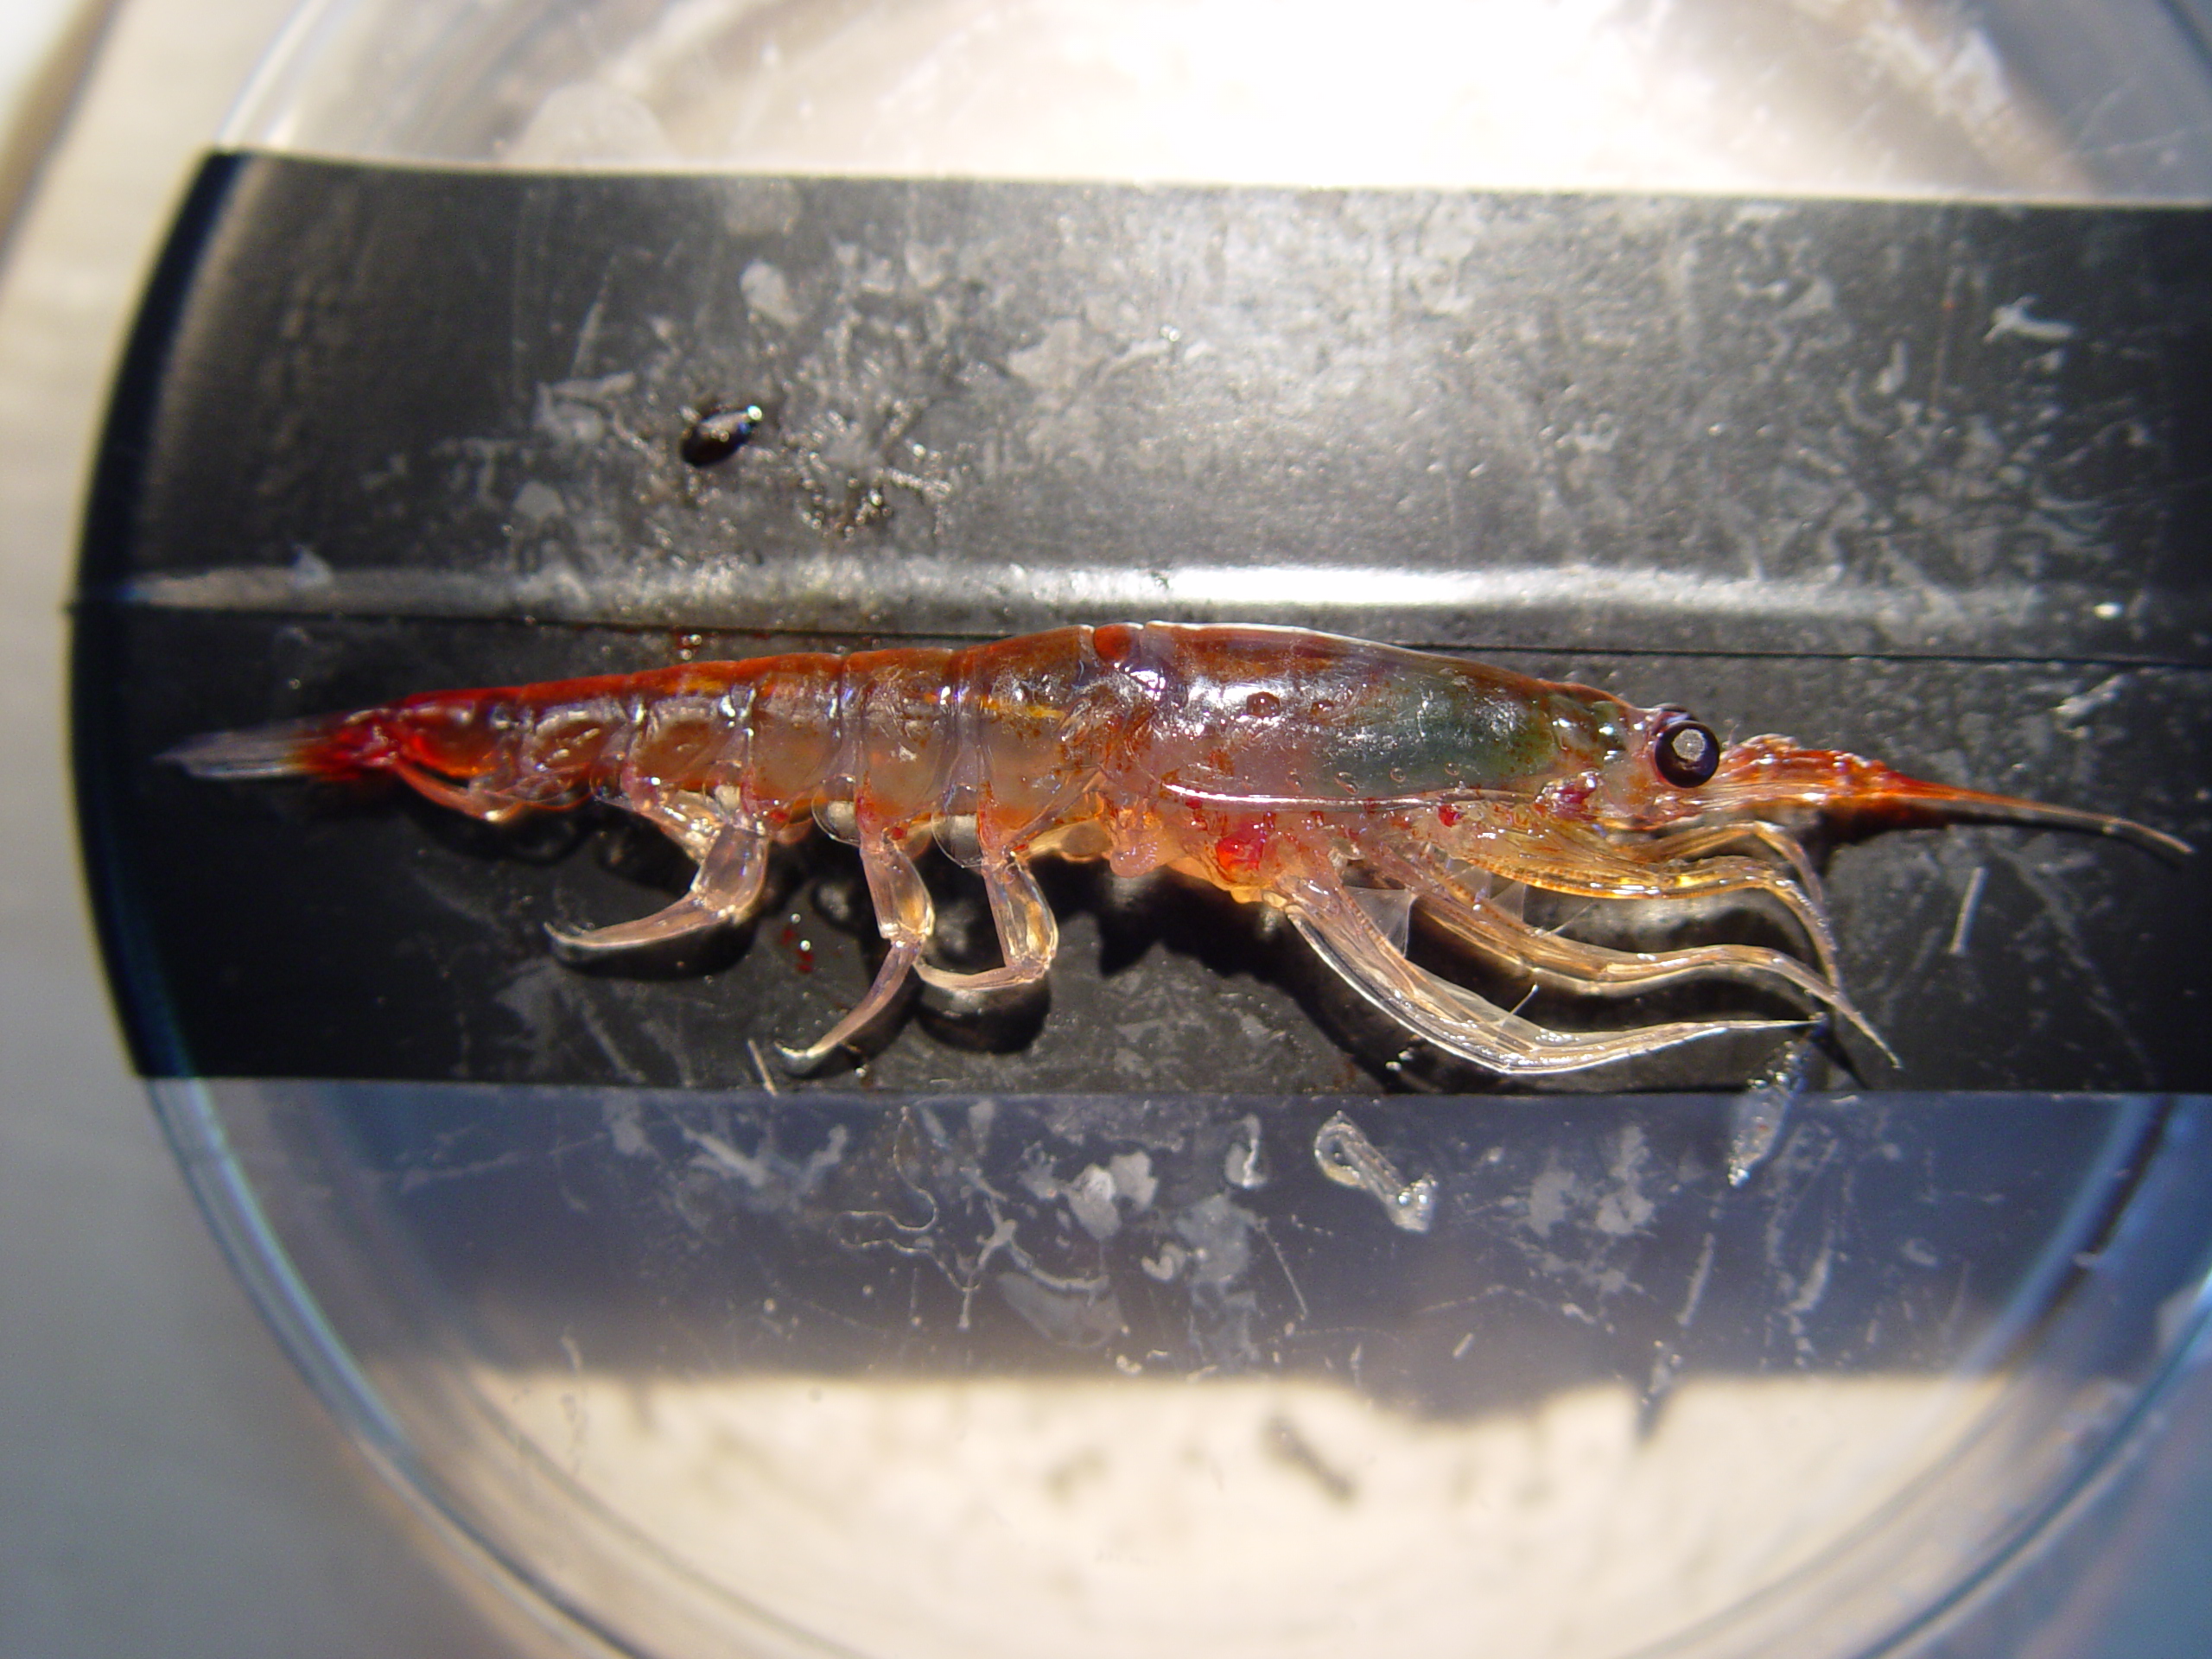
Antarctic krill are laid out in the lab for measuring.
With this data set we can answer questions such as these:
• Are the penguins and Antarctic krill distributed in the same patterns?
• Are these patterns correlated with phytoplankton concentrations?
• Have these patterns changed over the time series?