
IPY: The Next Generation
 1 comment
 PROVIDENCE, RHODE ISLAND– You might not know this (most people don’t,) but 2007-2008 is an International Polar Year (IPY). More than 60 countries, including the U.S., have developed large-scale polar research projects that rely heavily on international coordination and collaboration.
The IPY 2007-2008 logo.
This is the fourth IPY. The first was in 1882-83, the second 1932-33, and the last– 50 years ago in the height of the Cold War– was called the IGY, or International Geophysical Year. Because of the momentum and scope of the International Polar Year (think Olympics of Earth Science, but with all the countries on the same team,) IPY research tends to be big, bold, creative and transformative. That is, IPY research tends to fundamentally change the way we understand our planet.
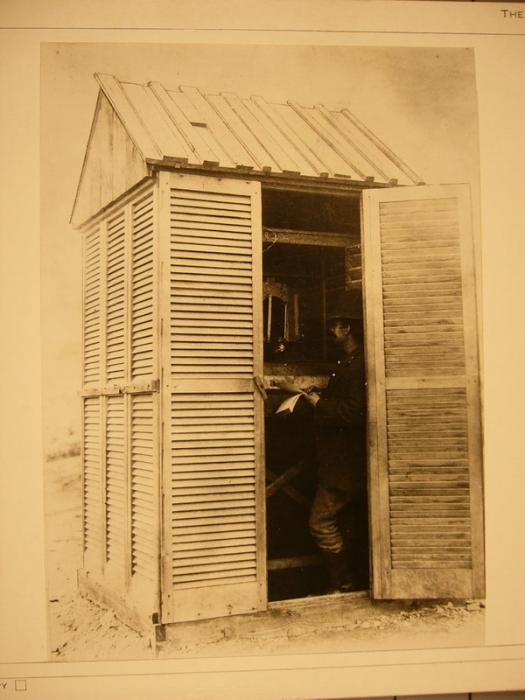
Sgt. Winfield Jewell reading meteorological observations at Fort Conger, Greenland, during the first IPY. Taken August, 1882.
Maybe you’ve heard of the ‘Keeling Curve’? It’s the graph that shows continuous measurements of the amount of carbon dioxide (CO2) in Earth’s atmosphere since 1957. This is a graph that everyone should see, because it represents actual measurements which clearly show the rapid increase in CO2 concentrations in our atmosphere over the past 50 years.
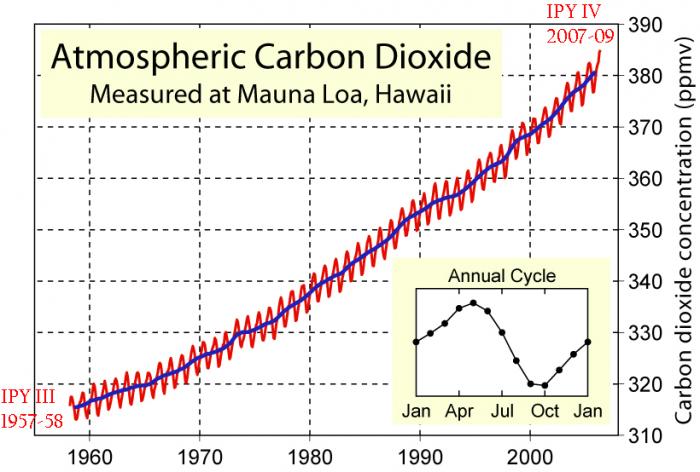
The Keeling Curve.
In 1957, during the last International Polar Year, a young postdoctoral researcher named Charles David Keeling proposed to measure the amount of CO2 in the atmosphere. Fifty years later, the Keeling Curve is a major piece of the scientific puzzle which shows us that burning fossil fuels increases atmospheric CO2 concentrations.
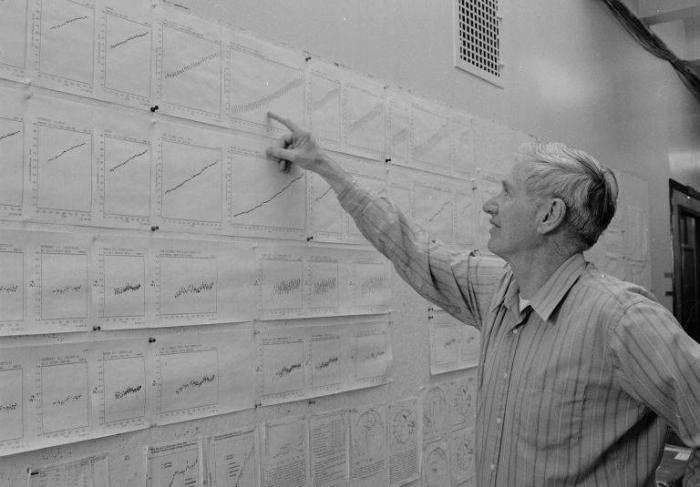
Dr. Keeling reading his graphs at the University of California San Diego’s Scripps Institution of Oceanography.
The CO2 measurements, in Keeling’s words, also showed “for the first time nature’s withdrawing CO2 from the air for plant growth during summer and returning it each succeeding winter.” He was talking about the annual ups and downs seen in the graph (the little zig-zags on the red line, and the “s” shape of the inset graph.) Atmospheric CO2 dips as trees put on leaves (Earth breathes in) and rises again after they fall off (Earth breathes out.)
Those of us who want to better understand the Earth have tremendous respect for Dr. Keeling’s legacy and for the scientific foresight that can fundamentally change the way we understand our planet.
In May 2008, I attended the Next Generation of Polar Researchers Symposium – an IPY workshop for young polar scientists. Early career researchers (just like Charles David Keeling during the last IPY) involved with different types of research in the Arctic and Antarctic were able to discuss research ideas with one another and form partnerships for future scientific collaboration. We are the polar scientists of tomorrow (and today) and we all have ideas we’d like to put into action just as Keeling did 50 years ago.
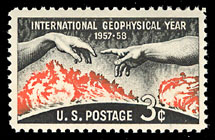
A 1958 U.S. Postage stamp commemorating the International Geophysical Year.
To get a feel for some of the questions motivating young polar scientists, I asked each workshop participant to tell me (in one sentence!) what they hope to understand through their research. Look for that video clip in my next dispatch.


Just noticed your great picture of Sgt. Jewell reading meteorological observations in 1882. However, Fort Conger is located on Ellesmere Island, Canada, not Greenland as the caption indicates.