
Phytoplankton from Space
 2 comments
 PALMER STATION, ANTARCTICA– Today I would like to show you the Palmer LTER study region in the context of the entire Antarctic continent, and one of the data sets that is collected by satellites.
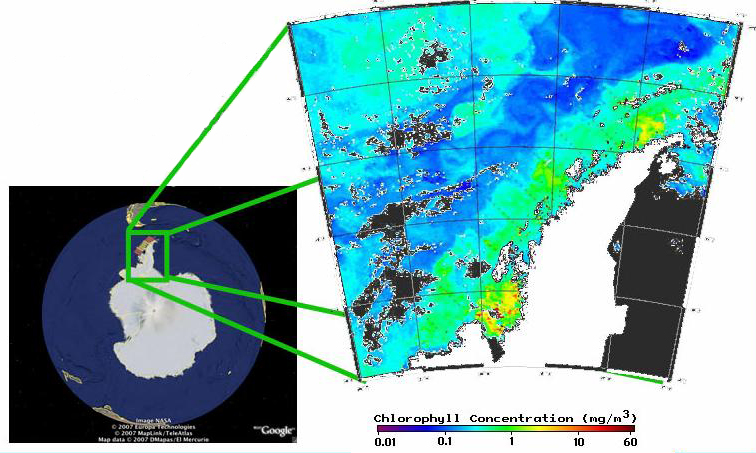
Phytoplankton concentrations viewed from space
Shown on the leftmost map above is the whole continent of Antarctica, with the southern tip of South America and the southern tip of Australia showing on the top and bottom of the globe, respectively. The enlarged portion of the map shows the Antarctic Peninsula, along which we are sailing.
The bright clear day we had on January 7th yielded a rare good view of the LTER study region from space. The colors on the inset map represent the relative concentration of chlorophyll present in the water. Chlorophyll concentration is an index of the biomass of the microscopic plants (phytoplankton) that are the base of the food web in the sea. The scale is below the map, with the warm colors indicating higher chlorophyll concentrations. The yellow-green color over most of the grid indicates chlorophyll concentrations of 1-3 milligrams per cubic meter.
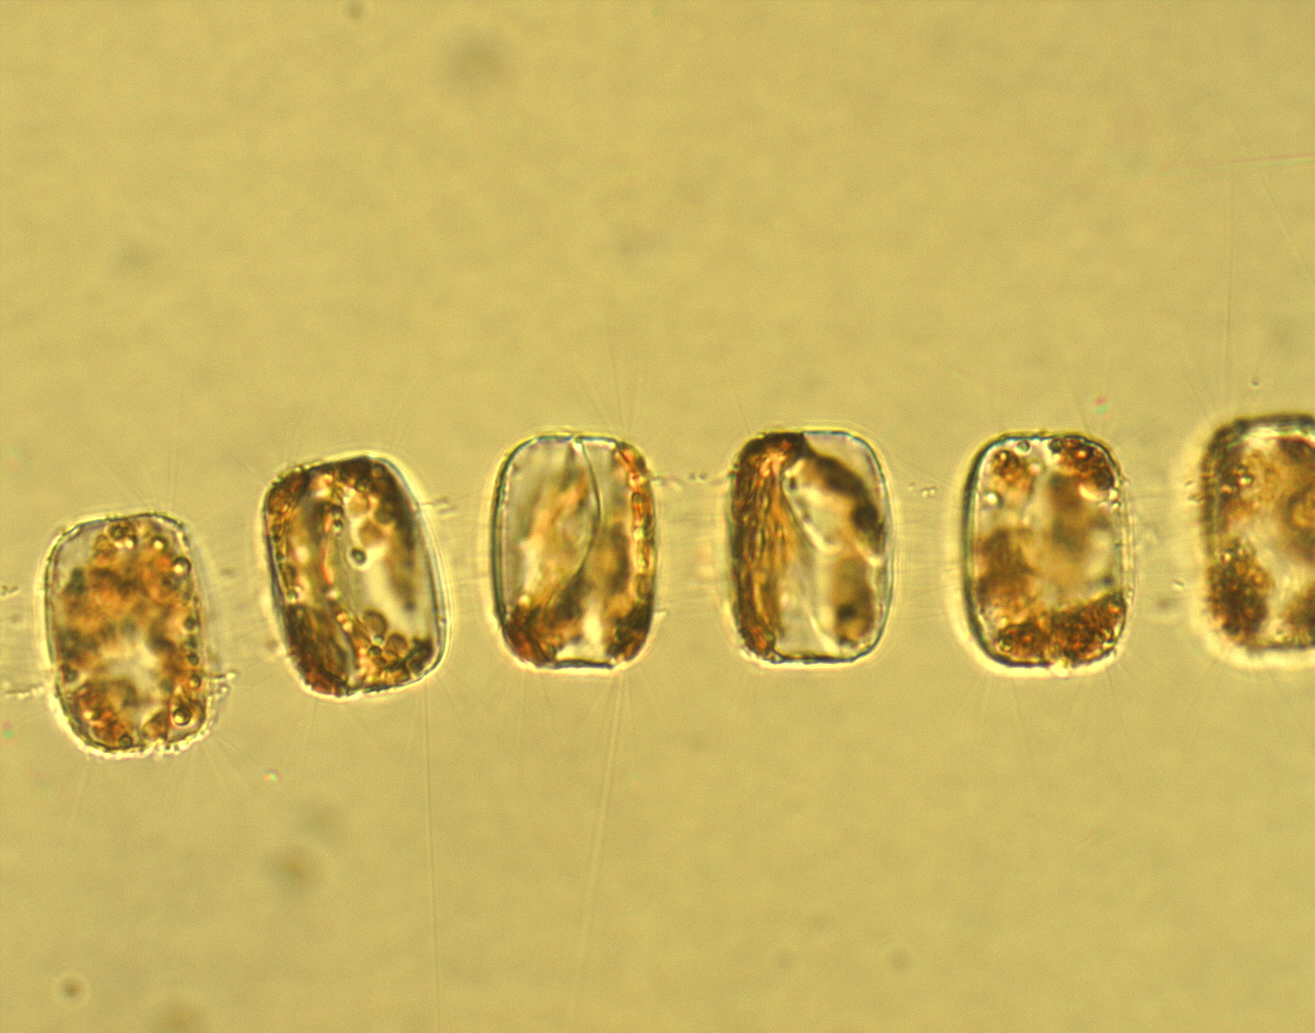
Phytoplankton under the microscope
Above, you can see a much closer view of phytoplankton. The individual organisms are only a few microns across, but are important food items for many of the zooplankton grazers in the upper layers of the ocean. The zooplankton are in turn food for seabirds, whales, seals, and most other apex predators.


I will be using this to teach my 3rd grade class about biodiversity.
That’s fantastic! Where do you teach? I’m very glad you’re able to utilize these resources to bring our field work into your classroom.
You’ll find a number of other dispatches about phytoplankton and zooplankton here on this site. To see a list of specific blogs on each, just click the “phytoplankton” or “zooplankton” words in the “Browse tags” sidebar link.