Measuring Atmospheric Carbon Dioxide at the South Pole
 No comments
 SOUTH POLE, ANTARCTICA– Carbon Dioxide is now one of the most studied environmental phenomenons. It has had such a boom in attention due to its properties and effects on the earth’s climate. By now everyone has heard of the “greenhouse effect” and how it works. Basically the shortwave radiation from the sun (ultraviolet) passes through the atmosphere and hits the earth’s surface and some is absorbed, while some is reflected. When solar radiation is absorbed it causes the surface of the earth to warm up which the surface is then emitting infrared radiation (heat). Carbon dioxide in the atmosphere (among other gases such as methane), just happens to absorb certain wavelengths of infrared radiation which causes some of that energy that came in from the sun to be trapped within the atmosphere.
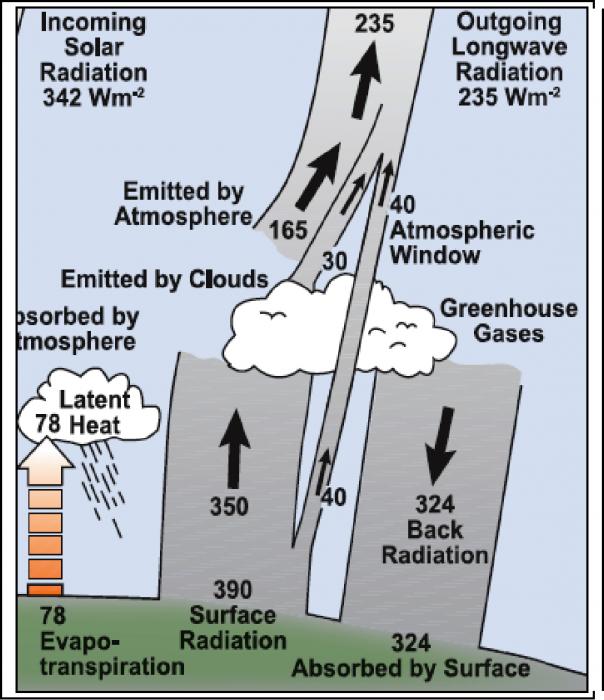
Part of the Radiation Budget, pulled from the IPCC Fourth Assessment Report. Source: Kiehl and Trenberth (1997).
Carbon dioxide has a carbon cycle much like water has the water cycle. CO2 is emitted and absorbed in numerous ways. Whether it’s a chemical reaction in the atmosphere that changes molecules of CO2 into something else, the combustion of a fossil fuel producing CO2, or the oceans taking in CO2 from the air and depositing it deep under the surface, they all play roles as sources and sinks of atmospheric carbon dioxide.
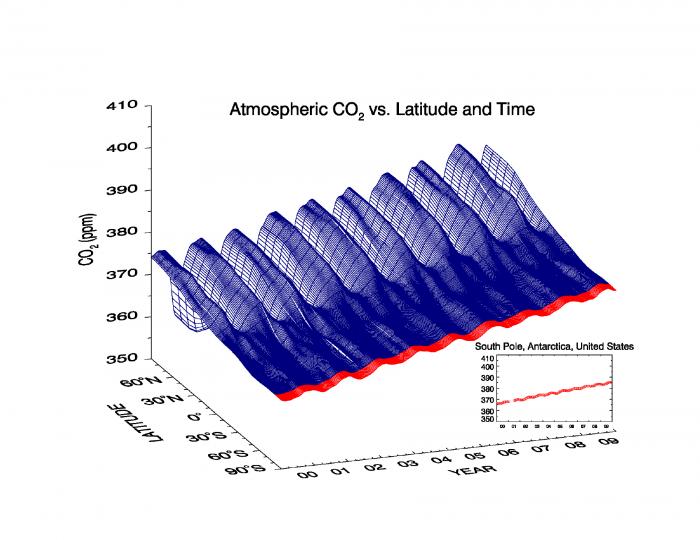
Figure from ESRL Carbon Cycle Greenhouse Gases Group. The data comes from the Carbon Cycle Network that includes NOAA Baseline Observatories (like the South Pole Observatory) as well as cooperative programs around the world.
The figure above graphically depicts the carbon cycle on an annual basis. The red strip indicates the data that has been gathered over the last 10 years from the South Pole. The waves in the graph are from the seasonal uptake of carbon dioxide by plant life. For example, in the summertime when trees have their leaves, and plant life is not dormant, you see a large dip in CO2 values especially in the northern hemisphere because plants take in CO2 for photosynthesis. Also notice the difference in variation (waviness) of CO2 between the Northern Hemisphere and Southern Hemisphere. This is due to the very large forests in the N. Hemisphere compared to the S. Hemisphere, and the fact that the N. Hemisphere is more populated. Aside from the annual variation, notice the steady rise of CO2.
In previous posts, we’ve looked at some of the instruments at the Atmospheric Research Observatory (ARO) that measure things like solar radiation. At the South Pole, carbon dioxide has been measured for just over 50 years now and there are a few different methods of obtaining a CO2 value.
One of them is using our Portable Sampling Unit (PSU) that looks like a suitcase containing a pump inside. Using the PSU, we walk out into the Clean Air Sector (CAS), turn on the unit, and pump air into glass flasks which are then shipped back to the Earth Systems Research Laboratory in Boulder, CO for analyzing. (I shot a video of the process which can be seen here.)
The second is hooking the same type of glass flask that we use in the PSU to the Through Analyzer. What this does is bottle up a sample using the same sample lines as our third method uses a Non-Dispersive Infrared Detector (NIDR).
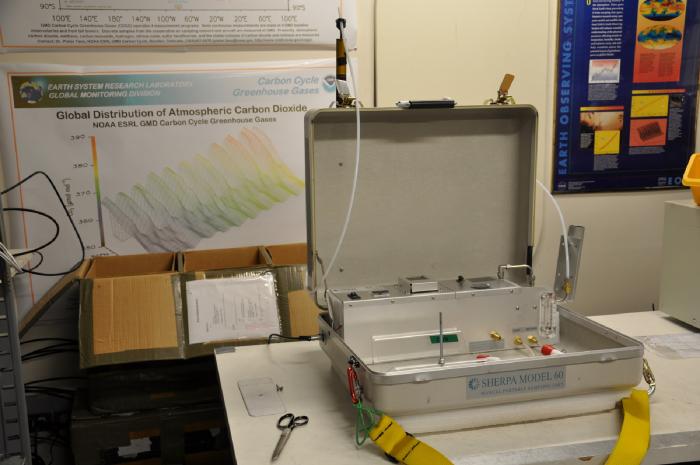
The Portable Sampling Unit (PSU). Flask samples with this unit are done once a week. On the first and fifteenth of the month, they are done in conjunction with sampling from the Through Analyzer.
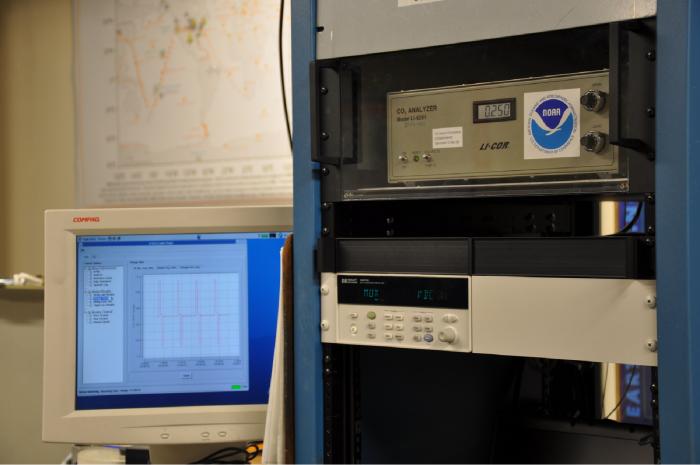
Upper right: The Li-COR Non-Dispersive Infrared Analyzer. Lower Left: A display graphing the voltages recorded over the past four hours. The spikes are the calibration gases measured once every hour.
The NIDR uses an infrared source which is a heated filament that emits infrared radiation around the same wavelength that carbon dioxide likes to absorb (usually around 4.26 µm). This energy travels through two absorption cells, one of which is containing a sample of air from outside, and another that is containing a reference gas from a compressed gas cylinder. A mechanical chopper wheel then alternates between the sample and reference gas measuring the difference in the amount of absorption between the two. Using the difference of the two cells helps negate the problem of changes in temperature and pressure. Changes in pressure and temperature change the density of the sample which would skew the amount of carbon dioxide molecules in the measurement. This is a very useful machine that requires very little maintenance and gives us measurements continuously 24 hours a day, 7 days a week (there is about 15 min of each hour that it measures accurate known amounts of carbon dioxide in other gas cylinders for calibration).
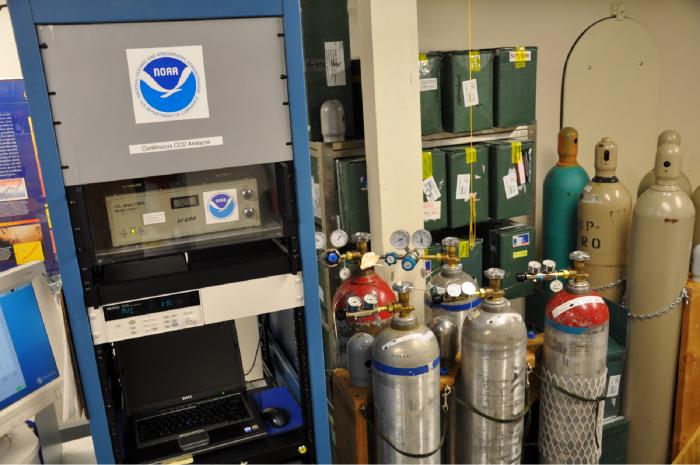
On the right are the three calibration gases and the reference gas.
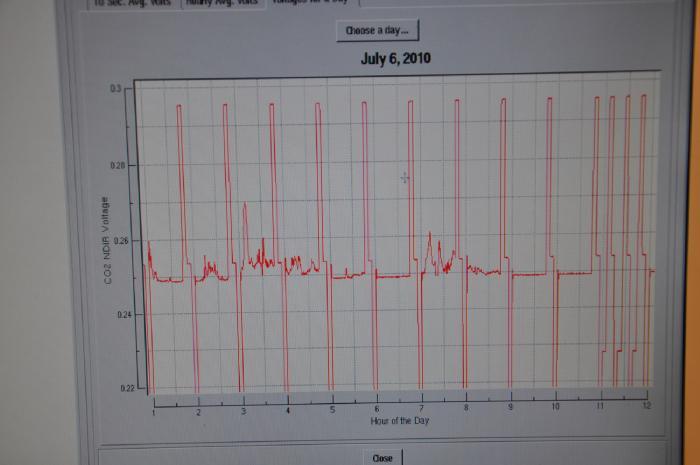
Here is a comparison of when the winds are in the Clean Air Sector (CAS), and when they are blowing station air towards the Atmospheric Research Observatory (ARO). The this graph is when the winds were from the direction of the station and the graph that follows is when the winds are in the CAS.
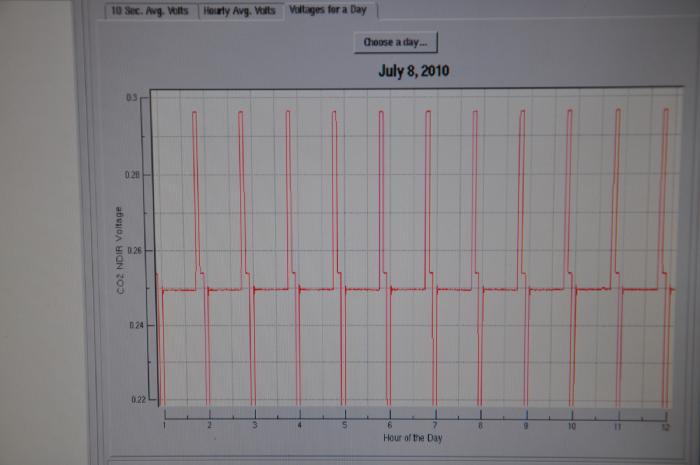
As you can see we easily pick up local carbon dioxide when the winds are blowing from the station. Winds at ARO are within the CAS probably greater than 90 or 95 percent of the time which is why it is such a good place to get long term continuous measurements of CO2.