Ears of the Deep, Part III: Placing a Mooring
 No comments
 ABOARD THE USCGC HEALY, ON THE BEAUFORT SEA– My last dispatch discussed the work of scientist Kate Stafford, who uses sets of acoustic sensors called hydrophone arrays to listen to the sounds of whales, dolphins, and other marine life. These sensors are placed on moorings, the subject of today’s dispatch.
Placing a Mooring
Kate’s moorings, like most others, are constructed to be placed on the sea floor at a particular location and depth. Locating nearly anything on the surface of the Earth has become much easier with the widespread use of the Global Positioning System (GPS) and its relatives (assisted GPS, differential GPS, carrier-phase GPS, Real-Time Kinematic (RTK) GPS, etc). Knowing the depth (and associated bottom contours) at a point in the ocean is less straightforward, yet these details are important for designing and manufacturing moorings, as these details affect certain aspects of a mooring’s design such as the amount and strength of cable required, the weight of the anchor to be used, the amount of buoyance required, etc.
Ocean depths are typically measured with an echosounder (see below) and then recorded on bathymetric maps. Contour lines of the same depth are called isobaths. The map below indicates our ship’s cruise track, mooring deployment/recovery locations, geopolitical data, plus a number of isobaths (black lines) and bathymetric data (salmon-colored tracks).
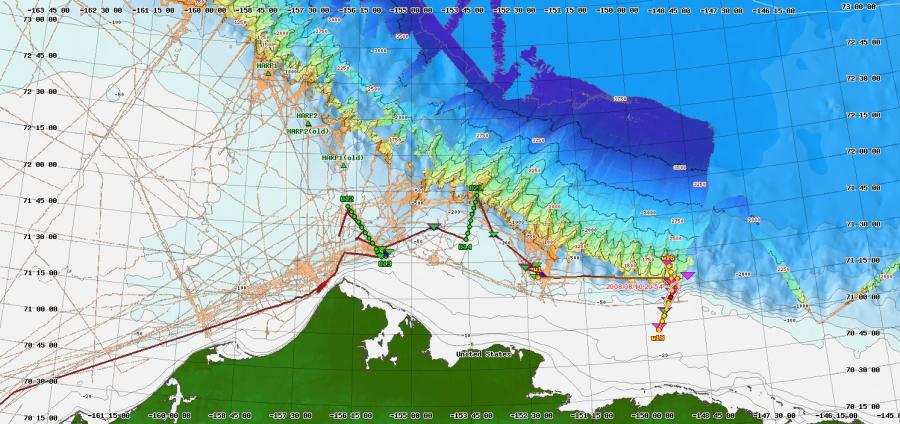
Cruise track, made available to the science party underway, had a number of optional overlays. This shows the track, geopolitical map, bathymetric data, and mooring deployments/recoveries.
The bathymetric data used to create such maps are measured using either airborne platforms (e.g. satellites) or ships’ sonar systems. Healy has a multibeam sonar system. Using multiple sound beams allows the ship to map out more sea floor information per unit time than would a single beam.
In Healy’s multibeam, sound is emitted through hull-mounted projectors in the form of short acoustic “pings” (which sound a bit like bird chirps when you are on one of the lower decks– bring earplugs if you have to sleep there!). The pings are 12KHz acoustic waveforms that bounce off the sea floor and are picked up by an array of hydrophones (also mounted on the hull). The amount of time between when a ping is sent and when it is received gives an estimate of how long it takes sound to travel to the bottom and back. If the speed of sound in sea water is assumed to be 1500m/s, then the depth (in meters) can be estimated as (1500)(t)/2, where t is the time (in seconds) between the sending and receiving of the ping. However, this calculation really isn’t good enough. The reason is because the speed of sound in water varies based on a number of factors, including temperature, salinity and depth. So, data collected from onboard instruments: an expendable probe (see XBT, below), a CTD that is repeatedly cast into the water (see my previous dispatch that describes the CTD), and archived data, are used to form a sound speed profile which is then used as input to the ship’s SeaBeam 2112 control computer to make corrections to the simple formula above. Using all this information, while also taking into account motion of the ship itself when estimating the time between sent and received pings, the computer can form an accurate bottom map that is made available to anyone on the ship and also shared with others back on shore through one of the various archives at LDEO.

WHOI Mooring Ops. Engineering and Field Support Group logo.
As you can probably see, there is a considerable amount of subtlety in how this works inside the computer. For example, the ship may be experiencing rolling, pitching, or yawing. Movements such as these (especially roll and pitch changes) affect how the beams are reflected back to the hydrophones, and all this must be considered when creating an estimate of far away the bottom is and what features it has. In addition, the temperature of the water varies as a function of depth and can change over time. To determine the temperature/depth relationship at a moment in time, a device called an expendable bathythermograph (XBT) and/or a CTD (described last in my dispatch) is used (e.g., once daily or when the ship moves into an area with different ocean characteristics) to measure the temperature/salinity/depth profile.

An expendable bathythermograph sitting on its launcher.
An XBT looks like a small rocket that is launched by a fixed or hand-held launcher off the ship; the ship can be still or moving. The XBT itself remains attached to the launcher by means of a very fine 2-conductor copper wire that unspools as the XBT descends toward the sea floor. As it descends, it measures temperature while its depth is estimated using an assumed falling rate. The resulting information is displayed to the user and used in forming the sound speed profile for the multibeam echosounder (and for a few other things). To learn more about the finer points of estimating sound speed in water, this link provides a number of more detailed references as a starting point.